Report
Field Monitoring Laboratory by FOLENS, in TUAT
Training for Environmental Data Acquisition and Assessment
Lecturers: Prof. Hideshige Takada, Assoc.Prof. Mitsunori Tarao and
Assist.Prof. Hirokazu Ozaki
 |
 |
|
| Photo 1. Soil sampling in TUAT’s test farm: how to / where to collect the samples with Dr. Ozaki. | Photo 2. Soil treatment in a laboratory |
 |
 |
Map 1. Tama-River basin and survey area near TUAT |
|
| Map 2. Sewage treatment plants (Tama-gawa Joryu and Hachioji water reclamation centers) and neighboring water sampling locations (St.1 and St.2) |
 |
 |
|
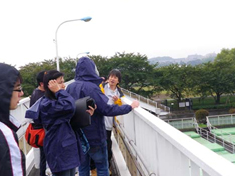
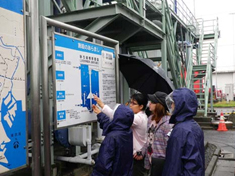
| Photo 3. Visiting Tama-gawa Joryu water reclamation center bordering Tama-River | Photo 4. Learn about sewage water treatment process |
 |
 |
 |
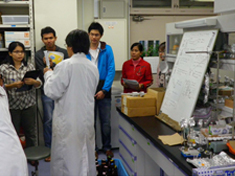
| Photo 6. Prof.Takada explains how to analyze antibiotic substances in the water sample | Photo 7. Assoc.Prof. Tarao explains E-coli and total coliform determination | |
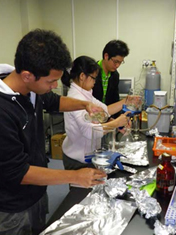
| Photo 5. Passing the water sample into membrane filter |
|
======================================================================================
“Training for Environmental Data Acquisition and Assessment” is a “basic pair” with overseas field training, uniquely-coordinated by FOLENS program. This training put focuses on the processes of survey planning, data calculation and data evaluation by analyzing soil and water. The main contents were soil sampling procedure in our university’s farmland and heavy metal determination (Cu, Zn, Cd, Pb and other), field survey in river (amount of flow discharge and on-site measurement of some parameters such as pH and EC, in Tama-River), water quality determination (antibiotic substances, anions, E-coli and total coliform density), and visit of sewage treatment plant. We studied how to deal detection limit, blank value, effective digit, and how many samples needed, how to evaluate confidence level of the results, and statistical procedure among parameters as well as a training of analytical technique. The goal is to acquire broad application skills in various environmental situations to be a “Field-Oriented Leader” in the environmental sectors.(HO)
======================================================================================
(1) Soil sampling and heavy metal determination…Download data (heavy metal)
When samples are collected from a certain survey area which is under a uniform condition (such as farm, paddy field, pond, test compartment), samples essentially have to be collected from plural spots where are randomly decided (Random Sampling). However, in many cases, sampling spots are simply set in equal interval using diagonal line (Fig.1). Therefore, we studied random sampling method (Fig.2) and compared it with diagonal sampling (conventional sampling method). Heavy metal concentrations (Cu, Zn, Cd, Pb and others) in the soils were analyzed with ICP-MS (Agilent 7500a) and AAS (Hitachi 5310).
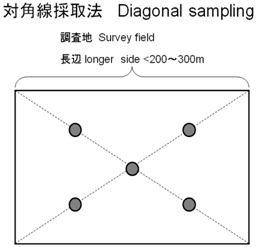 |
| Fig.1. Conventional diagonal sampling at a certain target, such as farmland, residential area, garden, pond, and so on. |
 |
| Fig.2. Random sampling using random number table (left) at location numbers 18, 6, 8, 28 and 30 in a target area (right). |
The result showed no significant differences between conventional and random sampling methods and between ICP-MS and AAS (Mann-Whitney’s U test, p>0.05, Fig.3). These facts indicate that conventional equal interval sampling is available in actual field works and analytical values are correct.
In the next step, we calculated how many samples needed to achieve 95% confidence level. On the other hand, the calculation often shows too many sample size to achieve it. It is difficult to collect and analyze so many samples in a practical field survey. Thus, we confirmed how to evaluate confidence level of the survey with fixed sample size based on a dispersion of measured value.
 |
| Fig.3. Zinc concentrations in soil samples collected by diagonal and random sampling methods, analyzed with ICP-MS (Agilent 7500a) and AAS (Hitachi 5310), showing non-significant differences between the methods and the instruments. |
(2) Anions in water samples collected from Tama-River and a sewage treatment plants…Download data (ions)
River water, sewage water and treated water were collected from Tama-River and sewage treatment plants located on Tama-River (Maps 1 and 2).
Figs.4 shows an analytical result of inorganic ion concentration in the water samples. Decomposition and removing organic matters are main process of sewage water treatment using microbial activity in activated sludge. While that, general secondary treatment is not very effective for removal of inorganic ions. Acidification of ammonium nitrogen (NH4-N) originated from fecal substance might be a significant reason why nitric nitrogen (NO3-N) increased in the treated water. Chlorination is still common to disinfect treated water to release to river thus it can be a cause of high ion content in the treated water. Advanced treatment (AO process, A2O process etc. ) is desired to remove nitrogen and phosphate to control eutrophication of aquatic environment.
 |
|
| Fig.4. Anion concentration of Tama-River water (St.1 and St.2), untreated sewage water (Tama-IN and Hachioji-IN), generally treated water (Tama-OUT and Hichioji-OUT) and ozonated water (Tama-O3 ). |
(3) Antibiotics substances in water samples collected from Tama-River and a sewage treatment plants…Download data (antibiotics)
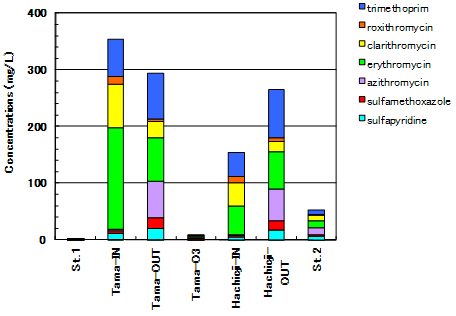
Very low concentrations of antibiotic substances have been acquired at St.1, where is located upstream of sewage treatment plant. In contrast, St.2 denoted an increase in antibiotic concentration than St.1 (Fig.5a). As “Tama-OUT” and “Hichioji- OUT” show, antibiotic substances cannot be removed efficiently in conventional (normal) secondary treatment. In fact, higher antibiotic concentration has been observed in Tama River after it received normally treated water. Therefore, this is probably due to a discharge from sewage treatment plant. By a long-term discharge of antibiotic substance to environment, repeat of “negative chain” is concerned that new tolerant microorganism may occur and accordingly new medicine development is needed.
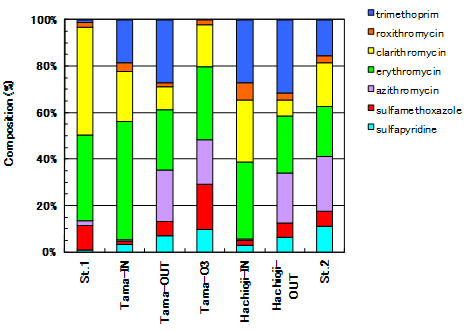
The secondary treated water from Hachioji treatment plant indicated higher antibiotic concentration than its untreated sewage water. Azithromycin in Macrolide series and Sulfapyridine and Sulfamethoxazole in Sulfonamide series were increased after the treatment (Fig.5a) both Tamagawa-Joryu and Hachioji sewage treatment plants. On the other hand, Clarithromycin and Erythromycin in Macrolides series were decreased in the treated water (Fig.5b). The change in antibiotic composition is obviously drawn in Fig.5b.
The lowest antibiotic concentration was observed in ozonated water (Tama-O3) among the treated waters. It is considered that ozonation is a effective procedure to decompose antibiotic substances for its strong acidification as well as disinfection, odor removal and decolorization of sewage water. However, it is not easy to introduce ozonation facility due to a lot of cost for installation, operation and maintenance. Continuous environmental monitoring, assessment and reduce of chemical use are needed.
 |
|
| Fig.5a. Concentrations of sulfapyridine, sulfamethoxazole, azithromycin, erythromycin, clarithromycin, roxithromycin, trimethoprim in Tama-River water, sewage water and treated water |
 |
|
Fig.5b. Compound composition of sulfapyridine, sulfamethoxazole, azithromycin, erythromycin, clarithromycin, roxithromycin, trimethoprim in Tama-River water, sewage water and treated water |
(4) E-coli and total coliform in water samples collected from Tama-River and a sewage treatment plants…Download data (e-coli and coliform)
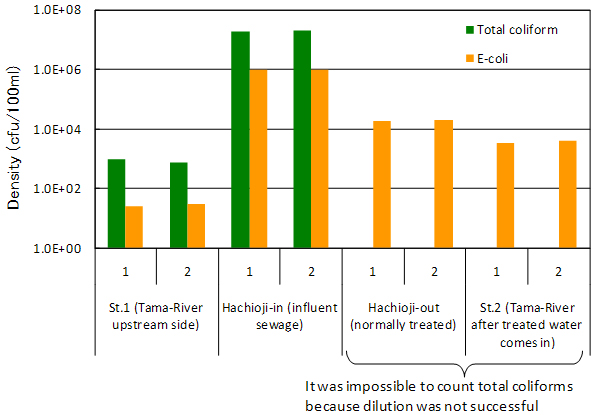
The densities of E-coli and total coliform (hereafter coliform) were larger in St.2 than St.1 (Fig.6). This is maybe due to an inflow of treated sewage water. At the same time, coliform concentrations were higher in untreated sewage compared with treated sewage water because of disinfection by chlorine. These facts indicate that chlorination plays a certain function in controlling coliform density in river water but can not remove all coliform from the sewage, and thus coliform concentration is increased in downstream water after the treated water comes in to the river.
 |
|
Fig.6. Total coliform and e-coli densities in water samples tested in duplication. |