For Members
E&R Base in Vietnam
By Drs. Le Viet Dung and Nguyen Van Be in Cantho University, Vietnam
The original data for water quality updated !
Download results of the water quality monitoring: Jan-01, Jan-30, Feb-29 and Mar-29 in 2012.
The regular water quality monitoring in Hau River at Cai Con and Tham Tuong Canal.
The figures below show seasonal trends of water quality analyzed by Can Tho University.
There shows larger variation in Tham Tuong Canal over the year. This might be associated to tide level, water flow direction and related input and output of human-derived and nature (ocean)-derived materials in the water.
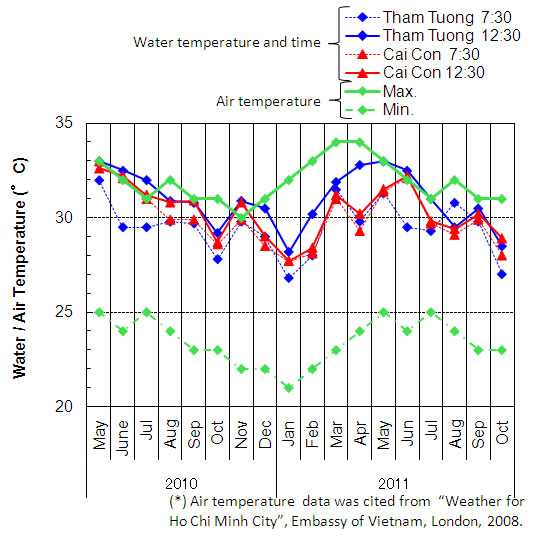 |
| Water temperature seems to have closer
relation to minimum air temperature and following maximum air temperature. |
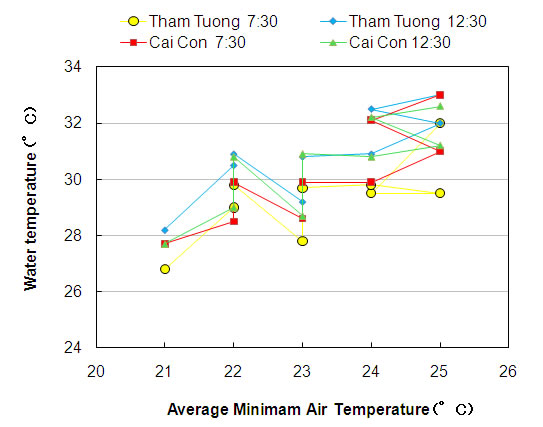 |
| Scatter plot diagram agrees the relation of water temperatureand minimum air temperature. Why with minimum temperature ? What about ground temperature? |
 |
| Seasonal trend of water EC. Higher EC and its larger variation in Tham Tuong Canal indicate remarkable water quality change. |
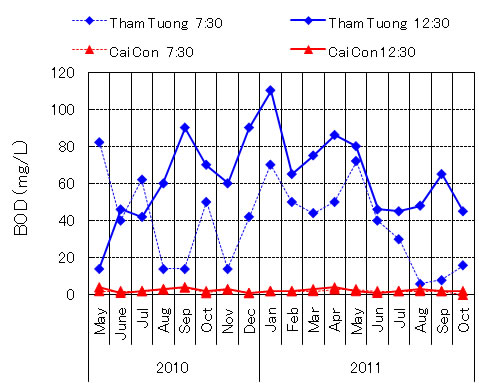 |
| BOD and COD are important parameter of water pollution espacially by organic matters. |
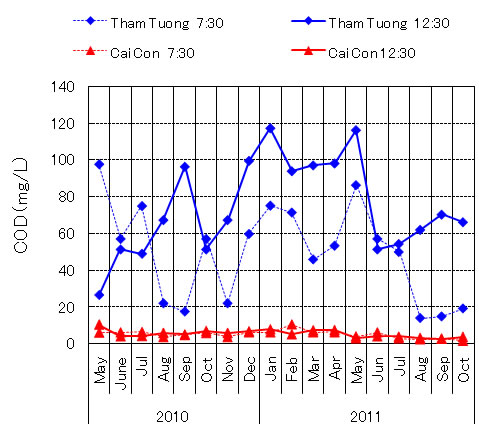 |
| These parameters also indicated a remarkable change in water quality in Tham Tuong Canal, flowing in the center of Can Tho city. |
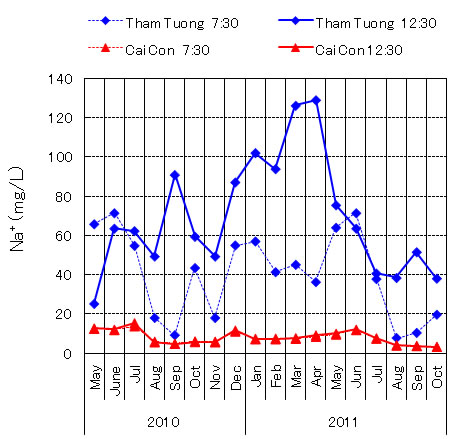 |
| Seawater can also be a source of sodium and chlorine (mentioned later). However, Tham Tuong showed significantly larger changes than those in Hau River. Does this suggest another factor to affect them? |
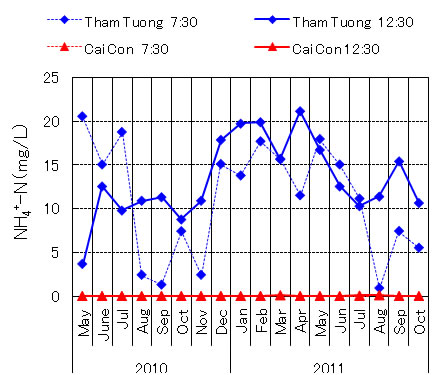 |
| Ammonium-nitrogen is a common indicator of evacuated material from humans and animals. This also shows larger concentration and larger fluctuation in Tham Tuong Canal. Can we really consider this anthropogenic effects? |
Scatter plot diagrams of several water quality parameters in Tham Tuong Canal in Can Tho City.
The diagrams may help us to study major factor of water quality change in city canal in Mekong Delta.
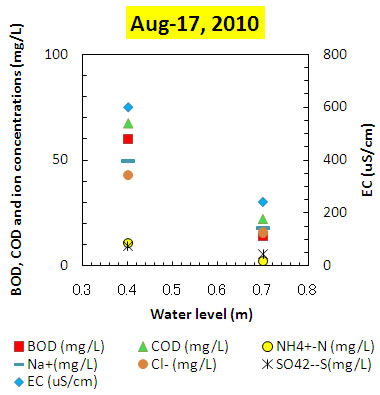 |
| Relationships between water level and BOD, COD, EC |
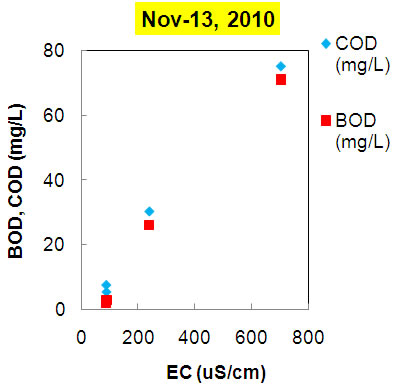 |
| Relationships between EC and BOD, COD |
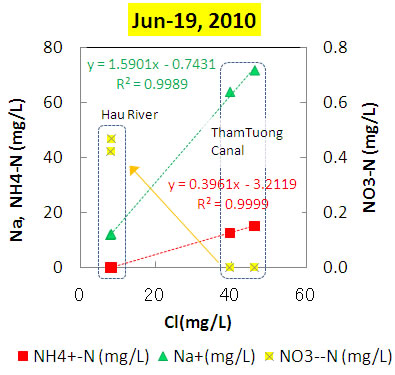 |
| Relationships between Cl and Na, NH4-N, NO3-N |
(1) Relationships between water level and BOD, COD, EC shown in the left figure was always clear throughout the past 9 month. This suggested that;
* Higher organic pollution and inorganic component in canal water during the low tide period.
* They are diluted during the high tide level period.
(2) Relationships between EC and BOD, COD shown in the middle figure indicate;
* They might be originated from the same / similar emission source.
* High EC might be due to human derived reason rather than seawater intrusion in Can Tho.
(3) It can be speculated from the right figure;
* Significant positive correlation between Na and Cl, and NH4 and Cl indicate that NaCl and NH4Cl are the dominant components of Na, NH4 and Cl in the canal water (green and red regression lines).
* It is well-known that NaCl is a major form of anthropogenic Cl.
* NH4 is an indicator of human and animal excrement. It is also produced during decomposition of organic pollutants. Then, NH4 is acidified to NO3 by a function of nitrate bacterium (yellow arrow). The slightly higher concentration of NO3 in Hau River water might agree with water flow and nitrate generation dynamics in environment.
* Their higher level during the lower tide suggests again that those ion are anthropogenic originated rather than seawater origin.
To see original data file, please click for
Sep-15, Oct-15,
Nov-13, Dec-13, 2010 and
Jan-11, Feb-10,
Mar-12, Apr-10,
May-10, Jun-09,
Jul-07, Aug-07,
Sep-05, Oct-04,
Nov-03,
Dec-02
, 2011 (excel files).
Go back to For member page.
The continuous river water monitoring is being done in Hau River at Cai Con and Tham Tuong Canal.
"Cai Con" is about 20km downstream of Hau River from Can Tho.
"Tham Tuong Canal" is located in the city center of Can Tho.
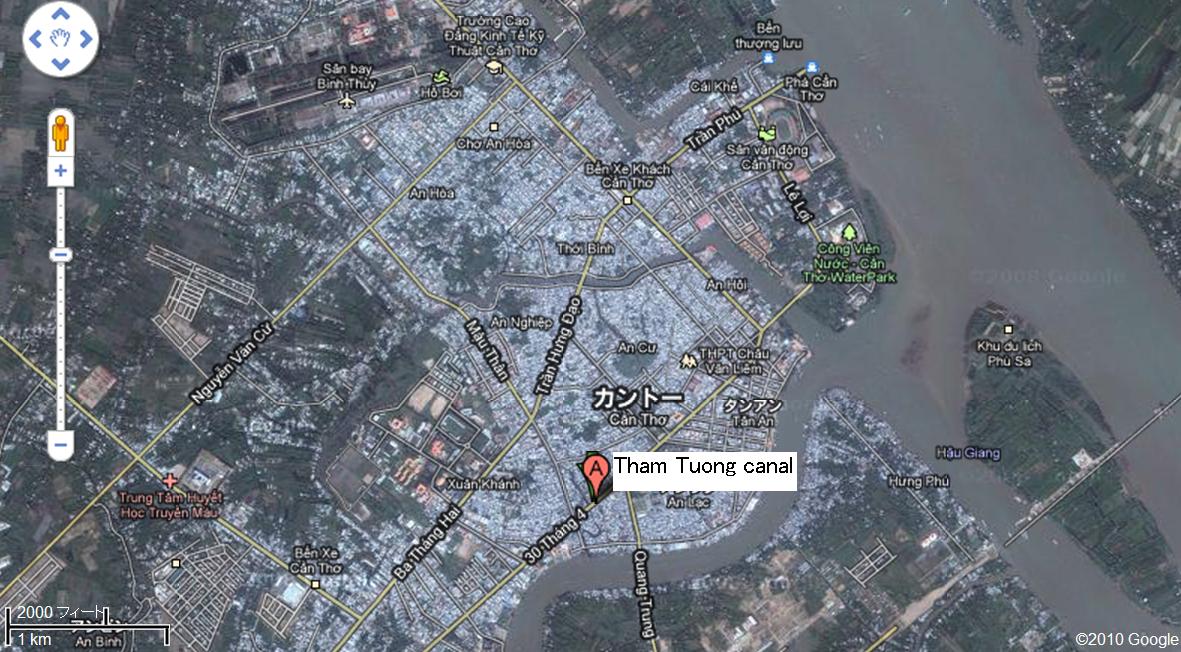 |
| Tham Tuong canal: 10° 1’ 40.71”N, 105°46’ 40.06”E |
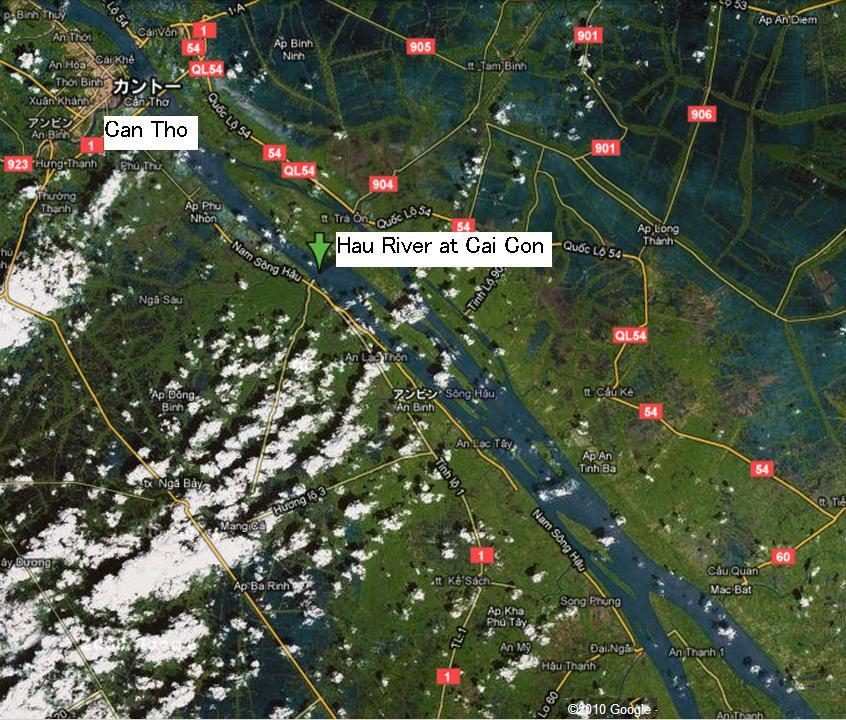 |
| Hau River at Cai Con: 9° 56’ 6.66”N, 105° 53’ 49.32”E |
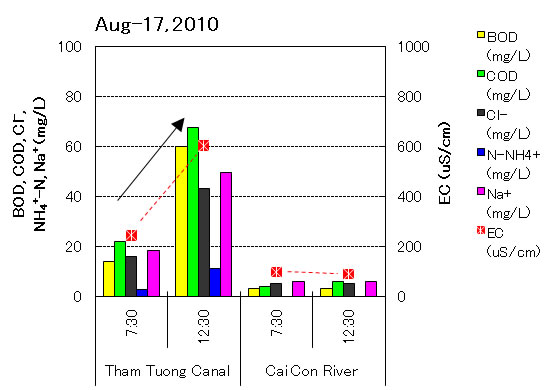
The water quality data clearly shows a contamination of Tham Tuong Canal.
Tide level (high and low tide) seems to be significant factor of water quality.
 |
| See original data file for August-17, 2010, click here (excel). |
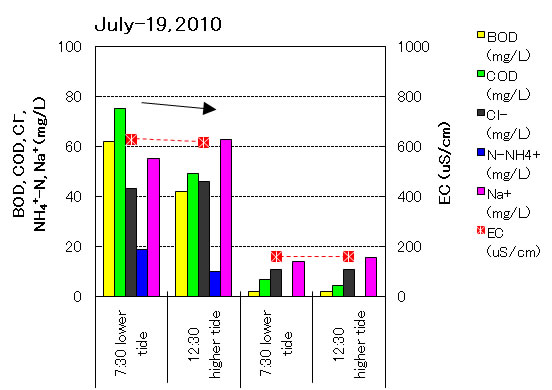 |
| See original data file for July-19, 2010, click here (excel). |
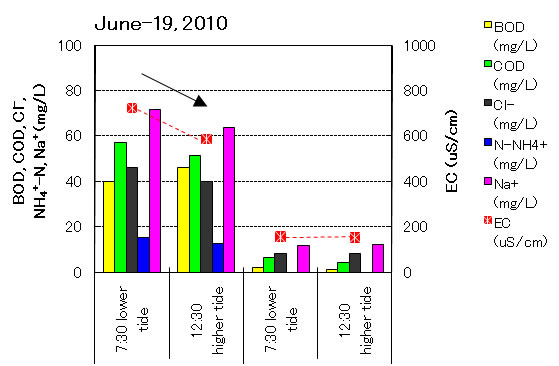 |
| See original data file for June-19, 2010, click here (excel). |
 |
| See original data file for July-19, 2010, click here (excel). |
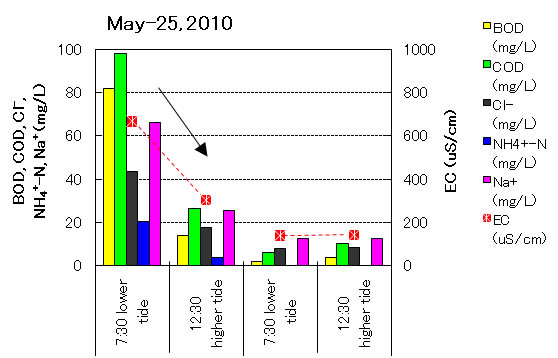
Water quality of Tham Tuong Canal has a large fluctuation. Water level increase could play to dilute the contamination in May.
However, the difference is much smaller in July and in June than that in May and became opposite in August..
So, we need / FOLENS students are encouraged to investigate what is the major cause of the water quality difference; high and low tide time, another industry, or monthly variation??
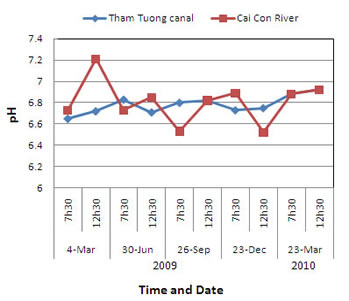
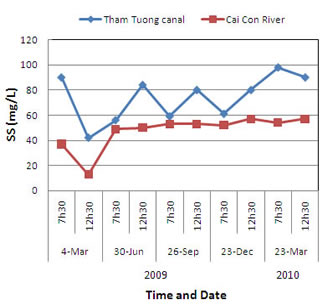
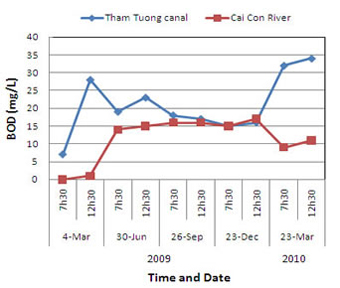
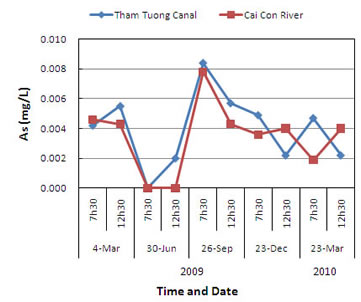
River water quality has been continuously monitored in March, June, September, December 2009, and March 2010 at two places, Cai Con River and Tham Tuong Canal.
The former is located in the Mekong Delta and the latter is in Ho Chi Minh City.
Data was obtained by Environment and Natural Resources Monitoring Center (ENRMC), Cantho DONRE.
| (1) The temporal trends of pH, SS, turbidity, BOD, COD and As. | |
 |
 |
 |
 |
 |
 |
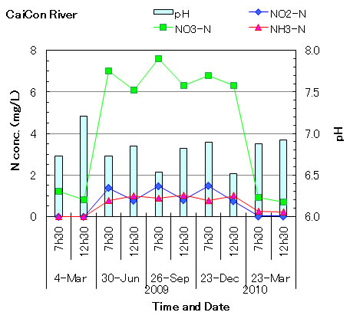
| (2) Nitrogen concentration and behavior | |
 |
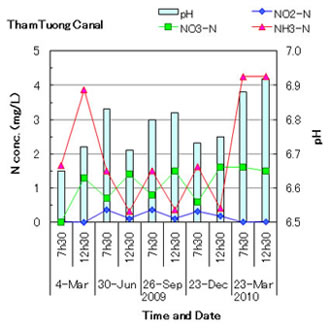 |
Cai Con River is located in Cantho, Mekong Delta, where is an active agriculture area. Similar trends were shown in NO3, NO2 and NH3-N in Cai Con River. This fact suggests similar source? Lower concentrations were seen in March in 2009 and 2010 and increased concentrations in June, September and December in 2009. Is this change a seasonal trend? Let us keep monitoring. In general, chemical fertilizer is a significant source of nitrogen in environment. Criteria value for NO3-N plus NO2-N is 10mg/L in Japan. How do you consider this concentration? Low enough or threshold amount? Opposite trends in NO3-N vs. NH3-N and NO2-N are shown in ThamTuong Canal. Is this a mutual change between NO3-N and the others?
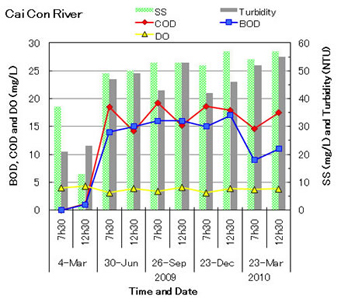
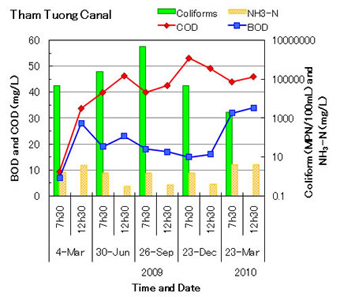
| (3) Relationships among BOD, COD, SS and turbidity | ||
 |
 |
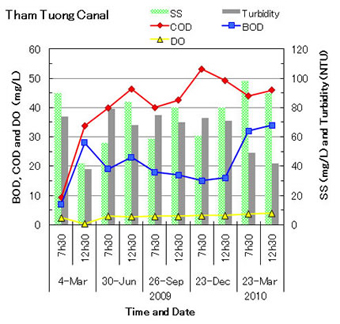 |
SS and turbidity seem major factor for organic substances in Cai Con River. But in Tham Tuong Canal, BOD and COD are not always correlated. Moreover, SS and turbidity have different trends from those of BOD and COD.
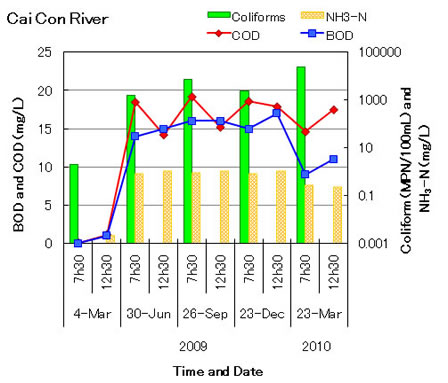
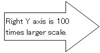
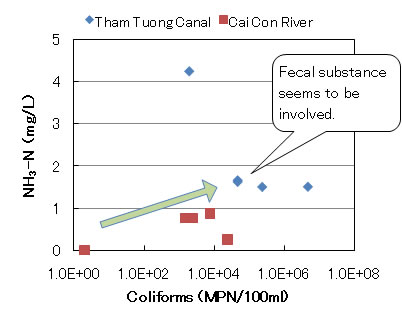
| (4) BOD, COD, fecal substance and other anthropogenic effect (?) | ||
 |
 |
 |
Coliforms and NH3-N indicate similar trends to those of BOD and COD in Cai Con River.
So are these major factors of turbidness ?
And something different in Tham Tuong Canal.
 |
 |
 |
To see original data click here (Excel)