For Members
By Professors. Samakkee Boonyawat, Poonmipope Kasemsap and Tiwa Pakoktom,
Kasetsart University
Efforts for the Better Environment at Kasetsart University: Land-Use and Environment in Thailand
Land use, land-use change and forestry (LULUCF) has large impacts on global and local environment. LULUCF influences carbon and water cycles and thus significantly contribute to climate change. Land use change in tropical countries, such as Thailand (Figure 1.), directly affects biodiversity. In addition, deforestation and subsequent alteration of landscapes from natural vegetation to agriculture and/or industrial use is the greatest cause of extinction of terrestrial species, especially in the tropics region.
Kasetsart University (KU) realizes the enormous impact of LULUCF on environment. KU researchers have been active on various research programs that contribute to better understanding of relations between land-use and environment in Thailand. KU and Tokyo University of Agriculture and Technology (TUAT) helped established several CO2, water, and energy flux observation sites in Thailand. These observation sites became part of ThaiFlux network which spans all over Thailand and includes sites located in natural forests, agro-forestry plantations and cultivated field crop plantations. ThaiFlux network has provided a valuable platform to promote collaboration and information exchange among Thai and international researchers. The rice observation sites in irrigated paddy field (Figure 2 and 3) in Kasetsart University Kampangsan campus was recently set up in FOLENS project. More details are shown as below.
~The report of November, 2010~
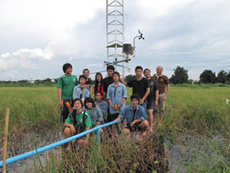
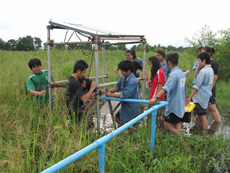
The atmospheric monitoring tower was built in paddy rice field in Kasetsart University. The tower is regulerly maintained by young researcher from Agronomy Department.
 |
 |
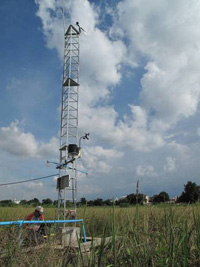 |
Fig.11 Maintenance of the atmospheric monitoring tower with young researcher from Agronomy Department |
Fig.12 Rising up batteries from flooded water. |
Fig.13 Nice scene in clear day. The data is being downloaded from irrigated paddy rice field. |
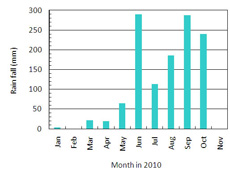
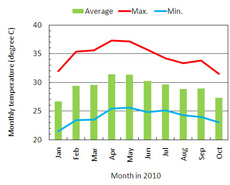
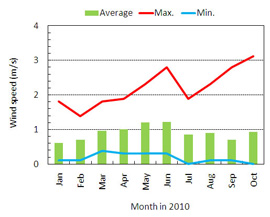
The figures below show monthly trend of rain fall, air temperature, relative humidity, wind speed and evapotranspiration in paddy rice field in Kasetsart Universtiy.
 |
 |
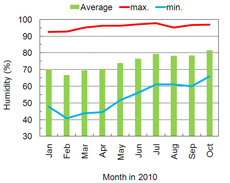 |
Fig.14 Monthly rain fall monitored in Kasetsart Universtiy, Bangkok from January to October in 2010. |
Fig.15 Average, max. and min, air temperature in paddy rice field in Kasetsart Universtiy, Bangkok from January to October in 2010. |
Fig.16 Average, max. and min, relative humidity in paddy rice field in Kasetsart Universtiy, Bangkok from January to October in 2010. |
The dry weather was normally in January to the end of April and relative humidity gradually increase when the rainy season come in the middle of May. The trend of RH is increase until the end of October due to the second peak of rain.
 |
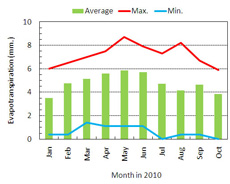 |
Fig.17 Average, max. and min, wind speed in paddy rice field in Kasetsart Universtiy, Bangkok from January to October in 2010. |
Fig.18 Average, max. and min, evapotranspiration in paddy rice field in Kasetsart Universtiy, Bangkok from January to October in 2010. |
Wind speed (Fig.17) was lower in January and the was increased until rainy season (May-Dec). Fluctuation was larger in rainy season than dry season (January-April). Thehigh wind speed was shown again in the beginning of November due to the effect of depression which hit southern part of Thailand in this period. Evapotranspiration (ET) is equal to water requirement. ET was gradually increased from January to middle of May and the was decreased (Fig. 18) due to a lot of cloud and rainfall. Fluctuation of ET was larger in rainy season than in dry season.
To see the original excel file, click here.
Go back to the member page .
~The report of March 2011~
Figure 1. Satellite image of Thailand Figure 2. White line show the boundary of Kasetsart University (Kamphaeng saen campus) which located in Kamphaeng saen City, Nakhon pathom Province and about 85 kilometers far from Bangkok. Yellow mark shows an irrigated paddy rice field site which locates in Kasetsart University On the 10th-15th July 2010, the 6 meters tower was build and then 1st-6th August 2010 we installed some instruments on the tower such as air temperature, wind speed and wind direction, net radiometer, rain gauge and relative humidity as shown in Figure 4-5. Now all the data are conducting and it going well. But for this reporting we would like to show the data set which conducted from 1st January, 2010 until 15th August, 2010. That data set were conducted from another weather station that is belong to Thai meteorological department and located in campus. Figure 3. Weather station in the irrigated paddy rice field Figure 4. Weather monitoring tower Figure 5. Installing instruments on the tower Figure 6. Daily air temperature including maximum, minimum and average temperature of the irrigated paddy rice field Figure 7. Daily relative humidity including maximum, minimum and average of the irrigated paddy rice field Figure 6, daily air temperature was lower in January because of winter season of Thailand and then gradually increased in February until its reach to the maximum on 8th May. Air temperature a little decrease from middle of May due to the beginning of rainy season. The air temperature from 1st January – 9 August, 2010 was fluctuating during 29-40.2 degrees C. The minimum air temperature was 16.1-28.1degrees C.
Daily relative humidity including maximum, minimum and average of the irrigated paddy rice field are show in Figure 7. The average relative humidity was fluctuation during 55-85%. The dry weather was normally in January to the end of April and relative humidity gradually increase when the rainy season come in the middle of May. Figure 9. Daily average evapotranspiration in the irrigated paddy rice field Figure 10. Daily average wind speed in the irrigated paddy rice field Rainy season in this area is starting in late of May and the pattern normally is bimodal. The second peak will occur in middle of September to the end of October. In this year, the maximum of rainfall was 63.7 mm which occurred in 29th June. Evapotranspiration (ET) is equal to water requirement. ET gradually increasing from January to middle of May and the trend was decrease due to a lot of cloud and rainfall. Fluctuation of ET was high in rainy season more than in dry season (January-April) as show in Figure 9.
Name
Paddy rice field site
Location
Kasetsart University (Kamphaeng saen campus) Nakhon pathom Province
Latitude
14°00' 32.75" N
Longitude :
99°59' 01.64" E
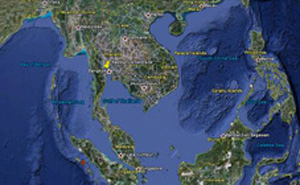
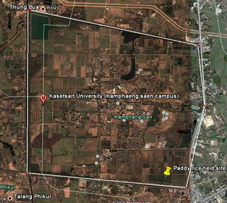
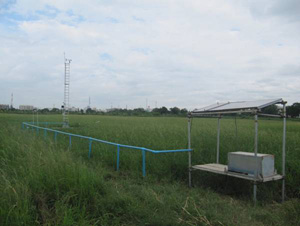

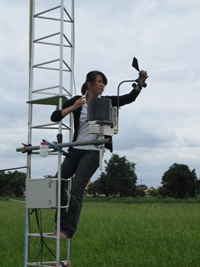


Figure 8. Daily total amount of rainfall in the irrigated paddy rice field