Home > Monitoring/Documents>E&R Base in Ghana>
For Members
Results of Measurement of pH and EC in water bodies at 2 points (upper stream and lower stream) on the River Volta and 2 wells in the city of Accra from 29th November, 2012 to 2nd December, 2012
During the period under consideration, the pH and EC of identified water bodies were monitored. From 29th November, 2012 to 2nd December, 2012, the coordinator of FOLENS GHANA participated in a symposium organized by CELENS in Japan.
Measurement of pH and EC in water bodies
The pH, EC of the River Volta. Data were collected from two (2) points along the river (Upper stream and Lower stream). The results are indicated below:
Table 1. EC and pH data of River Volta (Upper Stream) for the period under consideration
Upper Stream
| Parameter |
Month |
| Apr |
May |
Jun |
Jul |
Aug |
Sep |
Oct |
Nov |
Dec |
Jan |
Feb |
Mar |
| Electrical Cond. (µS/cm) |
60.3 |
60.4 |
60.1 |
60.0 |
59.8 |
59.7 |
60.5 |
61.1 |
61.4 |
61.6 |
61.5 |
61.4 |
| pH |
7.58 |
7.51 |
7.55 |
7.53 |
7.58 |
7.54 |
7.49 |
7.46 |
7.61 |
7.64 |
7.62 |
7.60 |
Table 2. EC and pH data of River Volta (Lower Stream) for the period under consideration
Lower Stream
| Parameter |
Month |
| Apr |
May |
Jun |
Jul |
Aug |
Sep |
Oct |
Nov |
Dec |
Jan |
Feb |
Mar |
| Electrical Cond. (µS/cm) |
60.3 |
60.3 |
60.0 |
59.4 |
59.2 |
59.0 |
60.0 |
60.3 |
61.1 |
62.3 |
62.4 |
62.2 |
| pH |
6.74 |
6.73 |
6.69 |
6.72 |
6.75 |
6.71 |
6.68 |
6.77 |
6.75 |
6.76 |
6.74 |
6.71 |
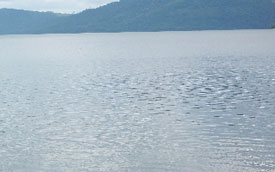 |
Figure 1. The River Volta |
Table 3. EC and pH data of Weija dam for the period under consideration
| Parameter |
Month |
| Apr |
May |
Jun |
Jul |
Aug |
Sep |
Oct |
Nov |
Dec |
Jan |
Feb |
Mar |
| EC (µS/cm) |
257 |
251 |
248 |
250 |
252 |
255 |
261 |
266 |
279 |
283 |
282 |
281 |
| pH |
7.45 |
7.41 |
7.32 |
7.34 |
7.40 |
7.42 |
7.39 |
7.33 |
7.44 |
7.51 |
7.52 |
7.55 |
 |
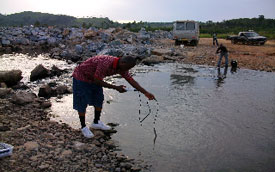
| Figure 2. Appearance of Weija dam |
Table 4. EC and pH data of River Densu for the period under consideration
| Parameter |
Month |
| Apr |
May |
Jun |
Jul |
Aug |
Sep |
Oct |
Nov |
Dec |
Jan |
Feb |
Mar |
| Electrical Cond. (µS/cm) |
568 |
567 |
566 |
542 |
542 |
544 |
567 |
568 |
575 |
577 |
276 |
569 |
| pH |
6.07 |
6.42 |
6.44 |
6.56 |
6.66 |
6.89 |
6.82 |
6.75 |
6.69 |
6.70 |
6.84 |
6.92 |
 |
| Figure 3. Appearance of River Densu |
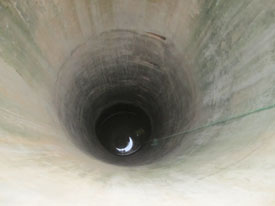
Measurements of EC and pH were carried out in well A (one hand-dug – 8 metres deep and well B (mechanically drilled – about 90 metres deep.
Table 5. EC and pH data of Well A for the period under consideration
| Parameter |
Month |
| Apr |
May |
Jun |
Jul |
Aug |
Sep |
Oct |
Nov |
Dec |
Jan |
Feb |
Mar |
| Electrical Cond. (µS/cm) |
740 |
743 |
744 |
748 |
755 |
759 |
758 |
742 |
734 |
726 |
727 |
713 |
| pH |
5.33 |
5.38 |
5.40 |
5.35 |
5.66 |
5.92 |
5.89 |
5.48 |
5.34 |
5.22 |
5.19 |
5.14 |
 |
 |
| Figure 4. Exterial appearance of well A |
Figure 5. Aerial view of well A |
Table 6. EC and pH data of Well B for the period under consideration
| Parameter |
Month |
| Apr |
May |
Jun |
Jul |
Aug |
Sep |
Oct |
Nov |
Dec |
Jan |
Feb |
Mar |
| Electrical Cond. (µS/cm) |
320 |
322 |
326 |
322 |
324 |
313 |
314 |
310 |
309 |
312 |
314 |
311 |
| pH |
4.51 |
4.49 |
4.53 |
4.54 |
4.45 |
4.56 |
4.64 |
4.52 |
4.42 |
4.38 |
4.39 |
4.44 |
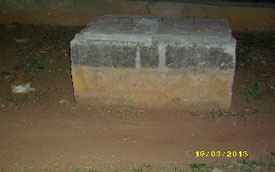 |
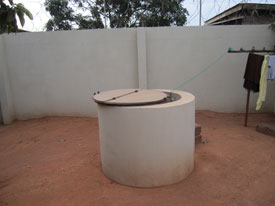
| Figure 6. Exterior appearance of Well B |
Copyright (C) FOLENS 2009 All Rights Reserved.