For Members
E&R Base in Ghana
By Drs. John Ofosu-Anim and Edward Benjamin Sabi, University of Ghana in Ghana
River and ground water, and soil have been monitored in Ghana. This time, monthly trend of river and well water pH and soil moisture are reported.
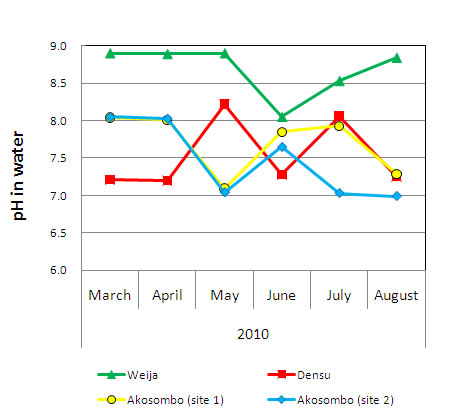 |
| Fig.6 Monthly trend of river water pH in south-eastern Ghana. |
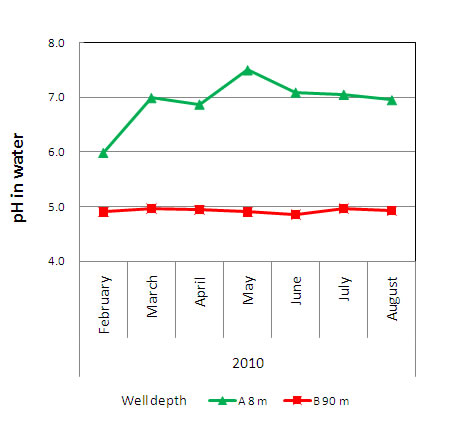 |
| Fig.7 Monthly trend of well water pH located in the Accra city area. |
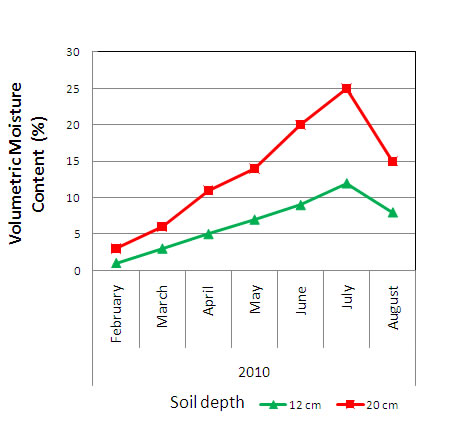 |
| Fig.8 Soil moisture in the field of University of Ghana. |
For Fig.6, Weija is close to recently developed residential hilly area and it could be that more water drainage (urban run-off) has effected to soil and water in the ambent environment. The Volta (reported previously) and Densu rivers have a lot of agricultural activities carried out along the banks thus agricultural runoff of water from these fields ( containing nutrients such as ammonium-nitrogen, and phosphates from fertilizer as well as pesticides) could be account for the high EC .
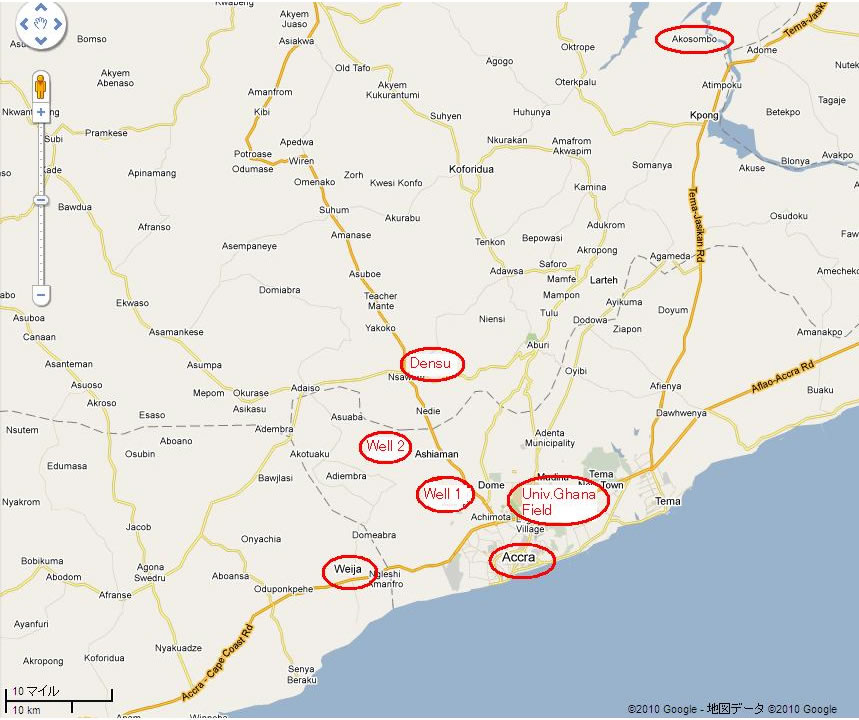 |
Fig.9 Locatioons of rivers and wells for water quality monitoring around Accra, a capital of Ghana. (See also Fig. 1&2) |
Fig.1 A Map of Ghana location, on the Gulf of Guinea in Mid-western Africa |
Fig.2 Volta River and University of Ghana, where the water samples were collected, and soil moisture was determined in farmland |
 |
 |
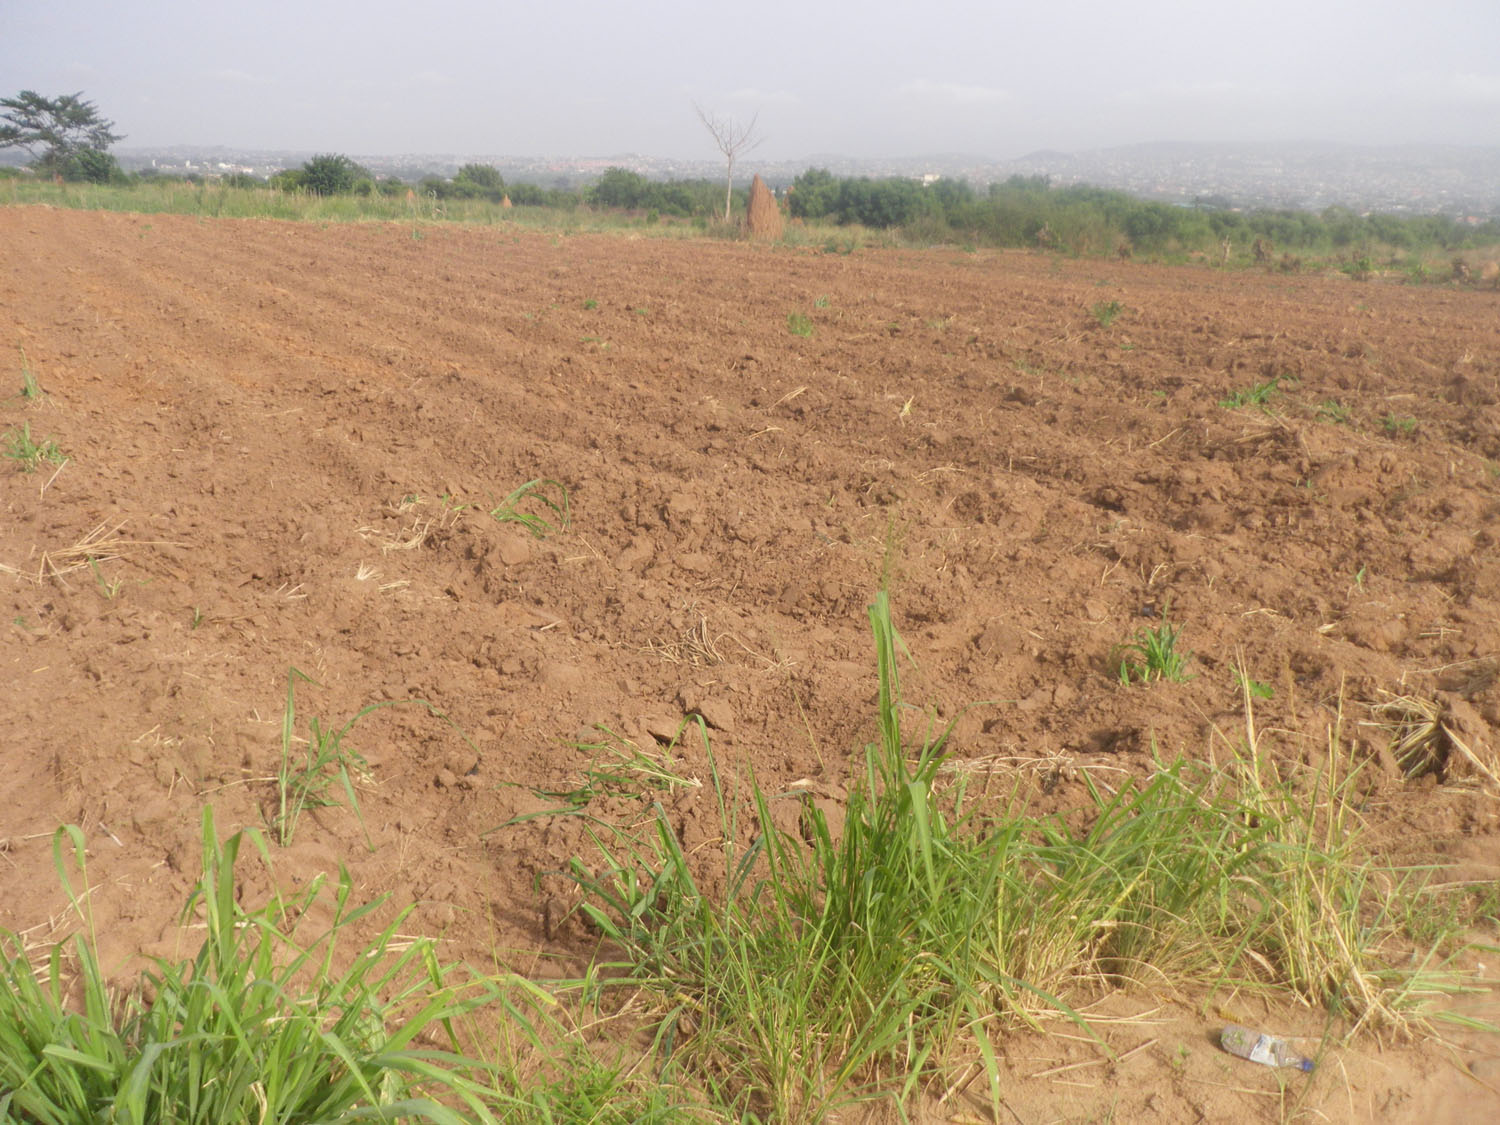 |
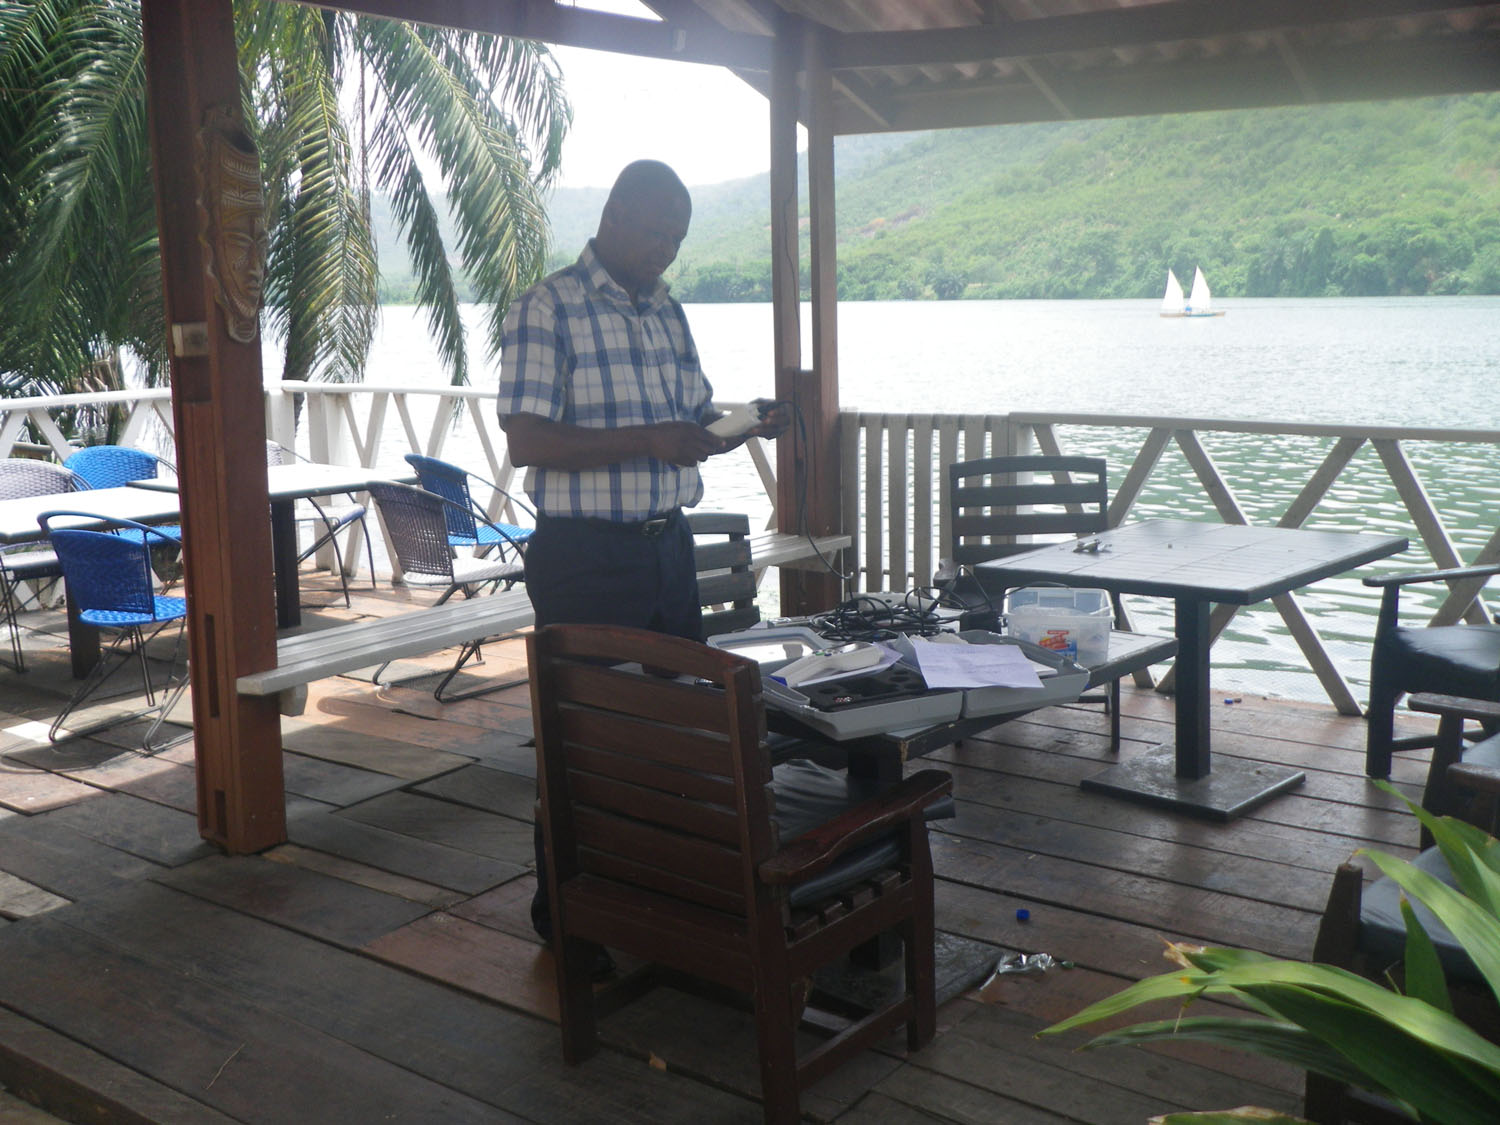
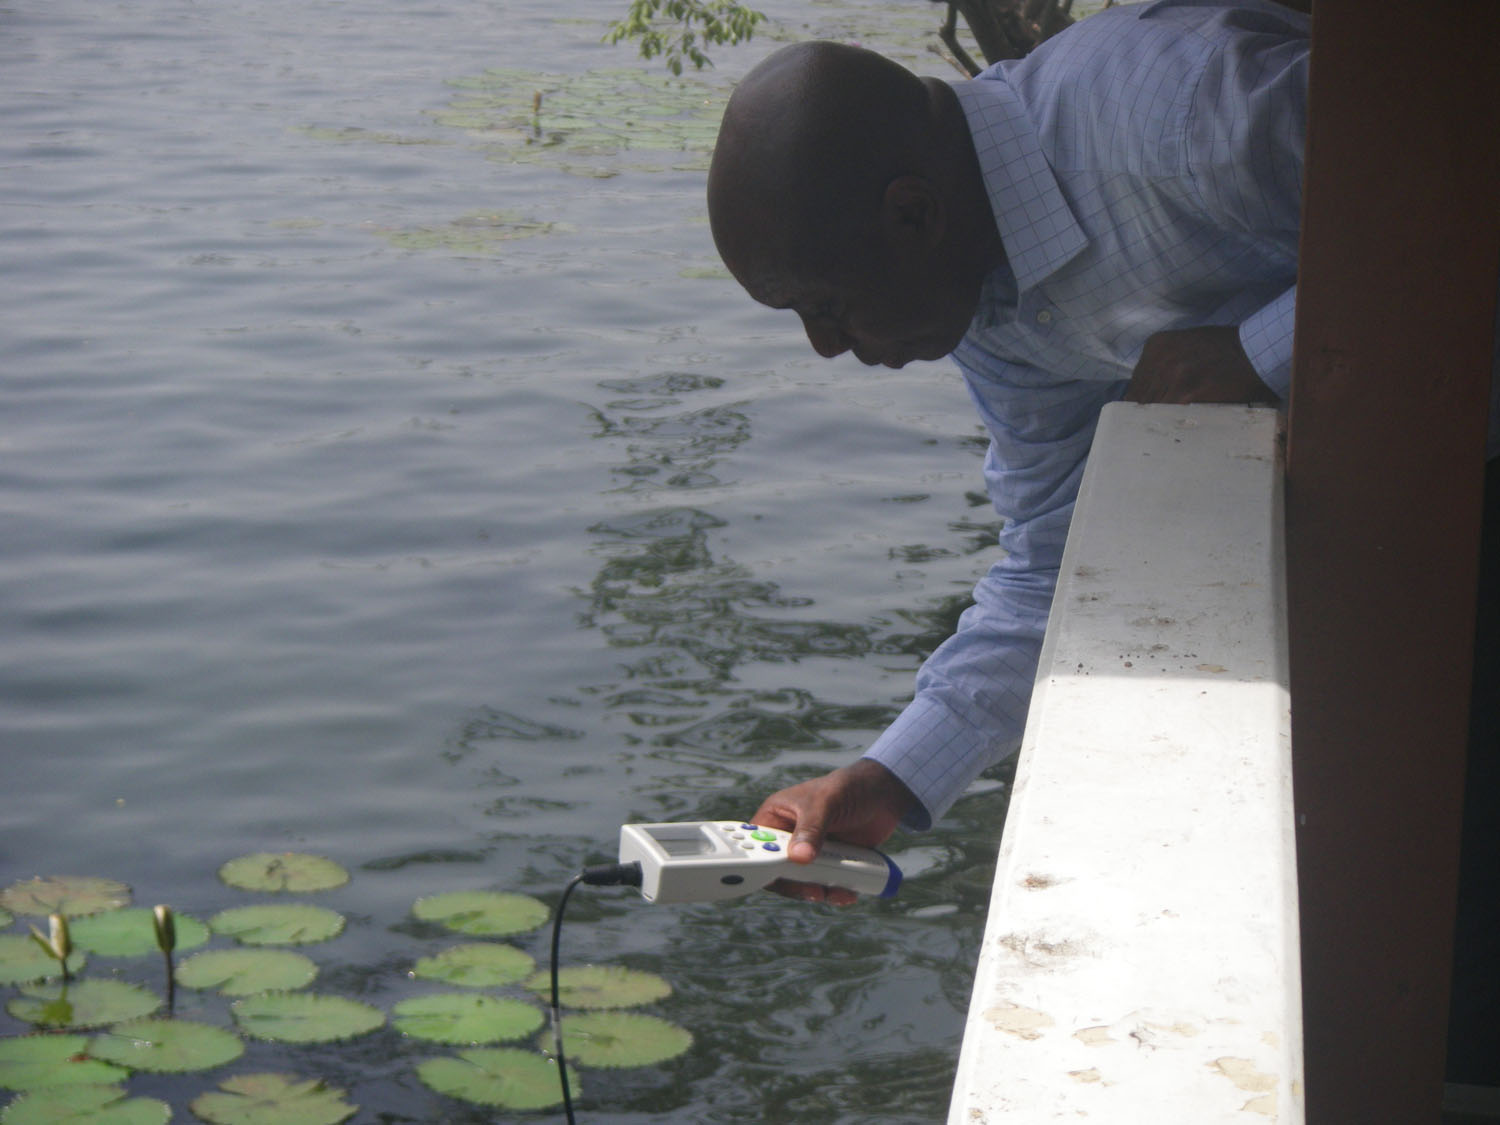
| Fig.3 and 4 Water quality monitoring in Volta River, located in the eastern part of Ghana. | Fig.5 Agriculture field in Ghana | |
Table 1 Observed values of electrical conductivity and pH in water collected along Volta River
| Point along river | Electrical Conductivity (µS/cm) | pH |
| 1 | 1550 | 7.12 |
| 2 | 1564 | 7.21 |
| 3 | 1571 | 7.16 |
Standard EC = 1413 µS/cm
Table 2 Electrical conductivity and pH in two well water. One was hand-dug – 8 metres deep
(Well A) and the other was mechanically drilled – about 90 metres deep ( Well B).
| Well | Depth (m) | Electrical Conductivity (µS/cm) | pH |
| A | 8 | 1473 | 5.98 |
| B | 90 | 1458 | 4.9 |
Standard EC = 1413 µS/cm
Table 3 Soil moisture content at 6 locations randomly chosen in the University of Ghana farm.
The values shown below are the averages for 12cm and 20 cm depths respectively
| Depth (cm) | Volumetric Moisture Content (%) |
| 12 | 1 |
| 20 | 3 |
To see original data file → Click here